![]()
/ Interface / Graph Editor
ChucK VM Panel . Workspace Panel
Code Editor . Graph Editor . Grid Editor
Image Editor . SoundPlayer
Log Panel . Graphical Plots
Wherein we elucidate mechanical aspects of visual programming in Fiddle.
Fiddle's
Graph Editorcouples with theCode Editorand theGrid Editorto provide the foundation for a ChucK composition workflow. We introduce the vocabulary of Graphs and discuss the interplay between Graphs and Code elsewhere.Here we present details of the Graph Editor interface.
As described elsewhere, the simple act of clicking on a
.chgin the Workspace Panel has the effect of opening the graph in its own Graph Editor panel. You can also trigger the creation of an empty graph session via the Layouts Menu.
Interface Components
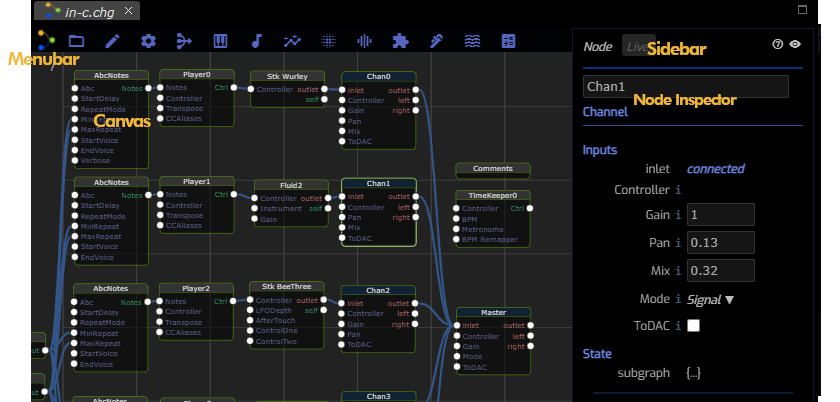
The Menubar

Most of the menubar is devoted to the Nodes that you instantiate and connect
to develop a graph. Node can either be created via these menus or with the
New Node dialog. Before we discuss Nodes, however, we present basic
file and edit operations.
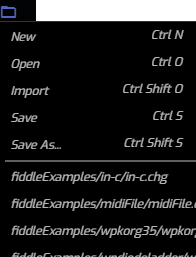
File Menu
folder_open
offers standard fare for opening, renaming and saving your graphs. ChucK
graph files are identified by the file extension .chg. It is this
class of file that the Graph Editor is responsible for editing.
If you select New, an empty, untitled graph will be constructed.
In contrast, select Open to fill the current session with the
graph found in a file that you select. It's usually preferable
to open graphs via the workspace,
but on occasion you may find these menu items handy.
Save and Save As... perform the obvious functions, the latter offers
you the opportunity to rename the file while saving. It should be noted
that Fiddle associates the temporary, generated .ck immediately
adjacent to your .chg files. In the process of renaming your graph
files you may leave around vestigial .ck files. Generally you are
free to delete files ending like .chg.ck as this signifies that they
can be regenerated from the .chg files.
Keep in mind that moving graph files from one place in your workspace to another is usually safe. This is because external assets (like soundfiles) are referred to with
workspace-relativepaths. In contrast, moving or renamingassetscan easily break the graph files that need them. The good news is that the.chgformat is ascii and can be searched and edited manually or with command-line tools likesedandgrep.
Import prompts you for an external .chg file and introduces the imported
graph file as a Group. Groups are useful for hiding complexity
as well as sharing work between graph files. Currently the import operation
is explicit and not referential. This means that if you make changes
to a previously imported graph file, the file that previously imported
it will not be affected. Here's a group subgraph viewed in is natural
habitat:
Groups have two different representations controlled by its
context menu. Above is the groups' expanded representation.
In this form, you can click on its internal nodes to see and edit
node parameters. When you contract the group, its internals
are hidden and it appears as a simple node and consuming
significantly less space.
Rounding out the File Menu is a list of recently opened .chg files
making it really simple to move from one graph to another within the same
panel.
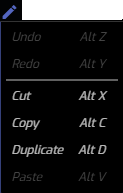
Edit Menu
edit
contains the usual collection of functions that operate relative to the current selection. In the
context of Graph Editor, the selections of consequence are Nodes and
once you've established
a selection of nodes via the Canvas you can Cut, Copy
or Duplicate them. There is an internal clipboard that stores
the results of these operations and it's relative to this clipboard the
Paste operates.
Note that Edges (wires) are preserved across copy+paste operations but
that Edges, themselves, can't be duplicated without accompanying Nodes.
You can copy nodes and selections between Graph Editor sessions and this is one way to migrate previous creations into new contexts.
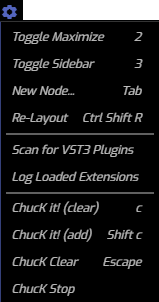
Settings Menu
settings includes miscellaneous commands that control your graph settings or view.
Toggle Maximize is common among many editors and allows you to cause
the associated panel to take-over the entire window. When maximized
this command restores the panel to its normal configuration.
Toggle Sidebar causes the Sidebar to appear or disappear. This
effect can also be achieved by double-clicking on a node or by clicking
on the tiny visibility icon in the
top-right of the panel.
New Node... causes the New Node dialog to appear.
The Tab hotkey is very handy, indeed.
Re-Layout attempts to automatically clean-up your current graph layout.
If you don't like the automated effect you can easily undo this action
via the Edit menu's Undo command.
Scan for VST3 plugins and Log Loaded Extension allow you to search
your system for VST3 plugins. The details of these items are described
in VST3 Plugins.
ChucK it! (clear) triggers the submission of the current (unsaved) graph
state to ChucK while clearing out all but the Fiddle foundation. This is a very
common operation when developing your graph and so the c hotkey goes
hand in hand with Tab.
ChucK it! (add) differs only from the previous command in that it doesn't
clear out other non-foundational submissions.
ChucK Clear has the effect of stopping all running, non-foundational
ChucK tasks. This operation is the first half of ChucK it! (clear).
ChucK Stop causes all ChucK activies to stop.
 mediation
 Session Menu
The session menu is first we've presented which is comprised of
Nodes. As with all ensuing menus:
making a selection will have the effect of instantiating one or more Nodes onto the Canvas.
We won't cover all of the Node Menus in detail here but the
Session Menu is worth delving into because its members
are commonplace to most functioning Graphs.
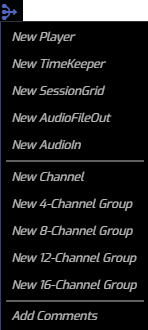
The Session Menu is home to:
- Player the primary means by which Instruments are controlled.
- TimeKeeper the keeper of time signatures and tempos.
- SessionGrid to integrate session grid data into your graph.
- AudioFileOut renders audio signal to soundfiles.
- AudioIn is the basis for recording live sounds.
- Channel conveys audio signals through effects on their way to final output.
- Channel Networks allow you create commonly used subgraphs which route Channels in Channel Groups.
Commentsare nodes whose only purpose is to store notes about how your graph operates.
piano Instruments Menu contains
Instrument Nodes. This link also describes
a special mode that causes the creation of Channel and Player nodes when
Instruments are instantiated. Individual instrument examples can be
found here.
audiotrack Notestreams Menu contains
Notestream Nodes. Check out a variety
of notestream examples here.
insights Control Change/Analysis Menu
contains nodes that generate or consume Control Signals.
Here are several examples.
blur_on Filters Menu contains audio
filter nodes. The distinction between a filter and an effect is a bit
fuzzy but there were enough nodes to fill menus that we place classic
DSP filters in this menu. You can find filter and effects examples
here.
graphic_eq Effects Menu contains audio
effects nodes. Delays, reverbs, VST3 Effects can
be found here. You can find filter and effects examples
here.
extension Chugins Menu is a ragtag band
of nodes organized around the idea that they are wrappers for ChucK's
built-in chugins.
waves Oscillators Menu houses a
collection of simple oscillator nodes. This nodes can play a role
similar to Instruments but also have uses as control signal sources.
You'll find examples mushed in with other filter and effects examples
here.
calculate Utilties Menu contains
you guessed-it nodes.
The Canvas
The canvas is where your musical creations come to life. As detailed elsewhere:
A graph is a collection of nodes whose parameters may be specified directly (by value) or indirectly through edges or wires. The graph's nodes and wires characterize the graph's topology. If you add or remove a node or edge you are changing its topology. Conversely, changing the value of a parameter has no effect on the graph topology.
The Basic Workflow
- Start a new graph
- Menubar -> File -> New
- Save it to a name ending in
.chg
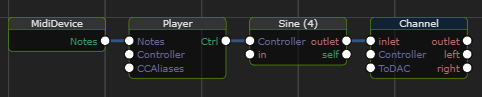
- Create a number of notestream +
player + instrument +
channel subgraphs. Here's a simple example that routes
notes from a MIDI keyboard through a custom ChucK instrument:
- Wire or rewire the connections from a Node's
outputsto another Node'sinputs. - Tweak Node parameters via the Node Inspector.
- Send the current composition state to ChucK with the
chotkey or via the canvas context menu. - Rinse, Repeat.
Anatomy of a Node
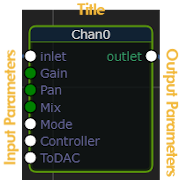
On the left side of a node are its Input Parameters or Ports. The
circles represent potential edge connection points. A green circle
with no connections indicates that the parameter value differs from
its default value. An Input Parameter can obtain a value either from
an upstream connection or from values you provide in the
Node Inspector.
On the right side of a node are its Output Parameters. Only
Output Parameters can be the source of a connection. All
new edges are initiated at Output Parameter Ports.
At the top of the Node is its Title. When the title background is
colored bluegray the node has an inner graph that can be viewed by
alt-double-clicking on it. In the case of Chan0, the inner graph represents
its optional Effects Chain.
When nodes have a bright green outline as indicated here, they are said
to be selected. The Edit Menu items operate relative to
both the current node selection set and the internal clipboard.
Canvas Mechanics
Create Nodes
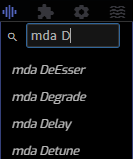
Nodes are created by either selecting them from the MenuBar
or from the New Node Dialog. Long node-lists can be filtered
by typing in the menu's filter field.
When a node is created, it is positioned in or near the center of your
current graph view and in the current subgraph. This is generally
not exactly where you'll want it so you'll need to position it manually.
The Settings Menu includes a Re-Layout feature than can be used to
re-position all nodes in the current subgraph in an orderly fashion.
Use this option with care since it will override node positions that you
may have carefully assigned.
New Node Dialog
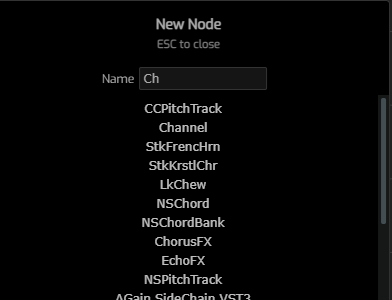
The New Node Dialog is a very efficient way to add new nodes to your graph.
You can invoke it via the Menu Bar, the Tab hotkey and via the
Context Menu. To create a new node, just type a few characters
of its name into the entry field. When the the list of matches reduces to a
single entry, simply hit return to trigger its creation. You can also use
arrow keys or the mouse to select a node. Other key-combinations to explore:
Ctrl/Cmd-Aselects-all for easy restartEscto dismiss the windowTab,Shift-Tabto shift keyboard focus
Pan and Zoom
Click-Dragyour mouse on an empty canvas triggerscanvas pannning.Mouse wheelingtriggerscanvas zooming.- When used in tandem you can quickly and easily inspect your graph at both macro and micro levels of detail.
Select and Position Nodes
Clickon a node or edge to select it.Shift-Clickon a node or edge to toggle its selection state.Clickon an empty region to clear all selected nodes.Click-Dragon a node or group of nodes to position it.Alt-Click-Dragto drag out a selection rectangle. When the mouse is released all nodes within the selection region will be selected.
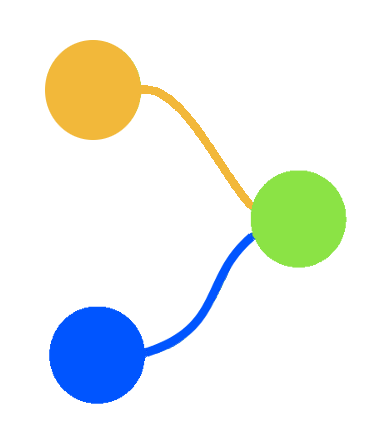
Create or Delete Edges
Click-Dragon an output node port to initiate the creation of a new edge.Drag-Releaseon an input node port to complete the creation of an edge. Only ports whose types are compatible can be successfully connected. A green or yellow circle signifies whether a proposed edge is viable as depicted here: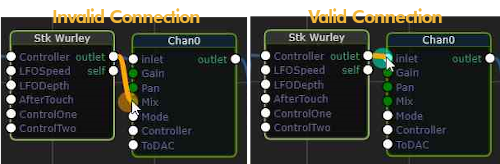
Some parameters support multiple connections while others support a single edge. In the latter case, creating a new edge will delete its prior.
Context Menus
Context-sensitive menus appear when you right-click in the Canvas. The contents of the menu depends on the mouse position when you click.
![]() The
The No-Context context menu is a shortcut to functions housed in the
Settings Menu and also serves as a quick reminder of
the hotkeys that also trigger its operations.
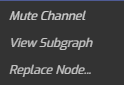
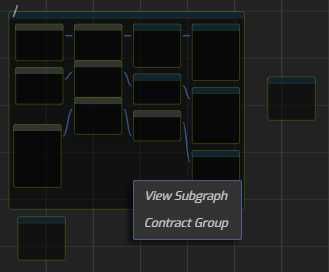
The Channel/Subgraph context menu appears when you right-click on
a Channel, ADSR or other subgraph node.
Mute/Unmute Channel is a shortcut to the Channel's
Mode parameter and only appears for Channel nodes.
View Subgraph causes you to "zoom in" on the contents of the subgraph.
This is the same sort of operation as alt-double-clicking to enter.
To "unzoom", just double-click on an empty zone. There are minor differences
between Groups and nestable subgraph nodes the most significant of which is
support for Expand/Contract state of a Group.
Replace Node... is a convenient way to select and replace a node in a single
operation. It is particularly useful when auditioning instruments and effects.
Where possible, this operation preserves instance counts and external connections.
If you aren't satisfied with the result, the operation is undoable.
The Sidebar
The Sidebar is a special overlay present on the right-side of the
Graph Editor panel. Currently it is the home of both the ChucK Live
and Node Inspector panels.
The Sidebar can be hidden or displayed with the hotkey, 3
or by clicking on the visibility icon you
can see in the upper right panel corner. You can also find the
visibility toggle in the Settings Menu.
The tiny help_outlined is a quick link
to this documentation page.
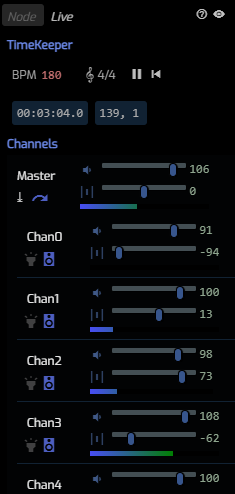
ChucK Live
The Live panel is used to tweak parameter values of a live ChucK session for an important subset of nodes. When there is no active ChucK session, this panel is either empty or populated by the vestigial parameters from your last live session. As described in TimeKeeper, some cases parameter-edits made here can be overridden by values that may emerge from Control Signals buried in your graph.
The Channel Controls that appear here also depend
on your graph. When you employ channel groups, you see
controls to solo (highlight)
the selected subchannels. In all cases the controls for
Pan, Gain and Mute (speaker)
are presented in a relatively compact form. Gain is presented in
decibels in the range of 0 to 120 representing actual gain values
between 0 and 10.
Node Inspector
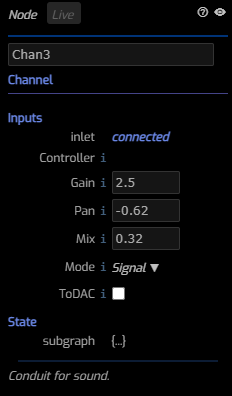
The Node panel is a sort of dual to its Live sibling. Here, all the parameters associated with selected nodes are presented. When multiple nodes are selected, you can inspect and modify values across them all.
Each parameter has its own type and value-range and editing modes:
- numbers can be edited with the mouse wheel and the keyboard. The nudge value is parameter-specific, so sometimes its small and others the nudge can be large (or integral).
- option menus provide an enumerated set of potential values.
For example, the
Modeparameter options includeSignal,Mute,Bypass.
Next to many parameters you'll see an i. This indicates that
the parameter has a tooltip that describes its function. To
see the tooltips just hover your mouse pointer over them.