
/ Interface / Audio Monitor Panel
Menubar . Workspace Panel . Log Panel . Fibers Panel
Code Editor . Image Editor
SoundEditor . SoundPlayer . EnvelopeEditor
Plugin Explorer Dialog
home . Topics . Interface . Reference . Examples
Wherein we reveal myriad tools for monitoring and controlling
Hz's audio engine.
Right-click to navigate subsections.
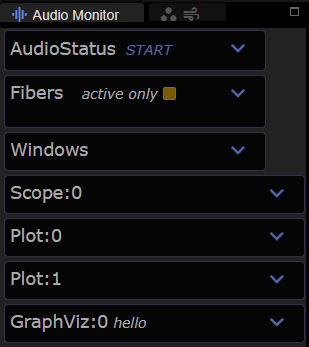
The Audio Monitor panel is the home of several subpanels useful in controlling and monitoring the state of Hz. The display of subpanel content is controlled by the open/close control at the top right of each subpanel. Here we see seven subpanels in their closed state.
The Subpanels
AudioStatus
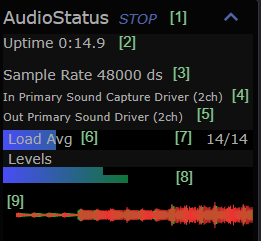
The AudioStatus panel allows you to monitor, start and stop the audio engine. When the AudioEngine is asleep this panel is empty but here we see it fully operational. Here are the details:
- START and STOP the engine with this toggle button. Launching music programs from the CodeEditor or Menubar may automatically start the audio engine.
- shows how long the engine has been running in minutes:seconds.
- when the engine is running, the sample rate and audio driver appear here. In this example, ds stands for direct sound, one of the common settings on Windows OS.
- this represents the selected input driver and depends on your Audio Settings.
- this represents the selected output driver.
- Load Avg shows a blue bar in proportion to the measured load on your system. Here we estimate that we're at 20% load which means there's ample headroom for more complex audio performance.
- At the right of load avg you'll see two numbers representing the number of voices active and known to the system.
- Levels shows the current instantaneous sound levels colorered according to distance from saturation. If you see lots of yellow or red here, it means you are overdriving the signals and should adjust signal gain accordingly.
- Shows a signal level trace for that last few seconds of sound.
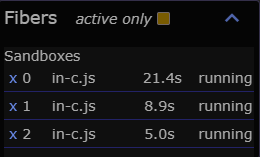
Fibers
The Fibers panel displays the current collection of audio fibers
known to the audio engine. As discussed elsewhere, there are two
kinds of fibers in Hz. We use Sandbox to refer to javascript async
functions and Lua to refer to active coroutines. Each time you launch
a new music program it will appear (possibly briefly) in this panel.
You can cancel long-running fibers by click on the x at its left.
Cancelation of sandbox fibers is a cooperative action since it is
only poassible if your script yields control.
In addition to the fiber name you can see its runtime which is updated
when the fiber yields. Next to that is the fiber status: running,
canceling, or done. Note that coroutines have a lifetime that is
independent of the audio engine. Stopping the audio engine doesn't
automatically cancel a fiber but will certainly prevent it from making
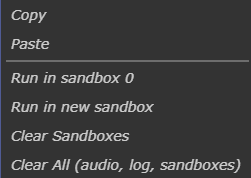
any sounds. Hz provides independent control over the sandboxes via
the context menu found within CodeEditor via
this context menu:
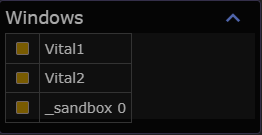
Windows
The Windows panel display the current collection of Anode GUI and sandowbox windows. Anode GUIs that don't support the webview GUI appear here where you can toggle their visibility.
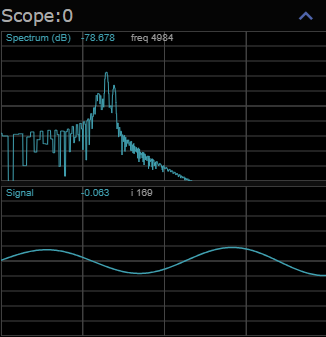
Scope
Audio scenes that include Hz.Scope produce spectrum and signal plots that appear here.
Plot:0, Plot:2
Your soundcape scripts can choose to plot signals to two 2D plot surfaces. This can be helpful in debugging, sonfication or mesmerization. The scrollwheel can be used to modify the Y-axis scale and hovering over any position in a plot will update the value and data-index in the plot's legend at top.
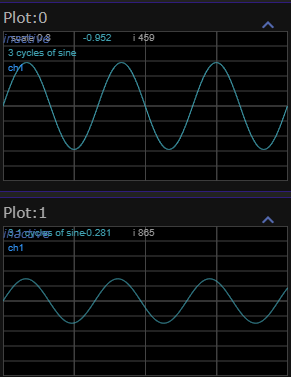
See examples for more details.
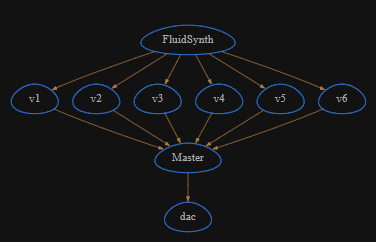
GraphViz
Your soundscape scripts can request visualization of the current Audio Graph using Music API's Agraph class. Keep in mind:
- complex soundscapes can have thousands of active nodes.
- multi-voice instruments often represent a voice with several nodes and this node count is multiplied by the number of live voices you request. To reduce visual noise you may wish to visualize only a single voice.
- each program fiber has it's own sub graph that is a proper subset of the total audio-engine graph.
Here's a simple graphviz:
You can use your mouse to navigate this panel as follows:
mouse-wheelto zoom in and outclick+dragto panhoverover edges to inspect a signal pathright-clickto reset the view
Credit
GraphViz is built atop the WASM packaging of the most excellent GraphViz.