/ Examples / Notestreams / Note Grid
NoteStreams .. Instruments
Filters .. Effects .. LiCK Effects
Plot .. Utility .. Pure ChucK
Wherein we demonstrate the simple conveniences of Note Grids. Right-click to copy this example to your workspace
NoteGrid Node
The NoteGrid node is reponsible for performing Note Grid files produced by the Grid Editor. Note Grids are the cousin of Session Grids and are focused, curiously, on individual note events rather than session events. The NoteGrid node is in the family of NoteStreams and, as such, requires a companion Player for most uses.
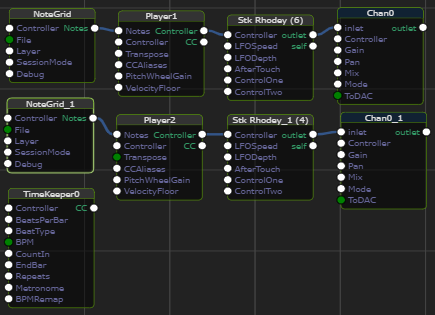
Here is a simple graph, noteGrid.chg.

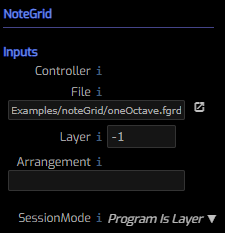
And here is the NoteGrid Node inspector.

Controller is an optional connection point for an upstream
Session Grid Node. When connected
you can "inject" the notes from this node anywhere in your composition.
File is the name of the .fgrd file to perform.
Layer is the layer id in the associated file. -1 means play all layers.
Arrangement If your note grid contains sections you can arrange
them with an expression like: ((A2B2)C)2 where letters are section
identifiers. Numbers represent repeat counts so this example produces
AABBCAABBC. Square brackets and | can be used to introduce randomness
into your arrangement like: ((A2[B|C2])C)2.
SessionMode assigns an interpretation to incoming Program requests
when an upstream SessionNode is connected. The options are pretty self
explanatory:
- Program Is Layer
- Program Is Section
The two NoteGrid nodes refer to two different .fgrd files, scale.fgrd and
oneOctave.fgrd. After copying this example to your workspace you can click
on these files to examine them in the Grid Editor.
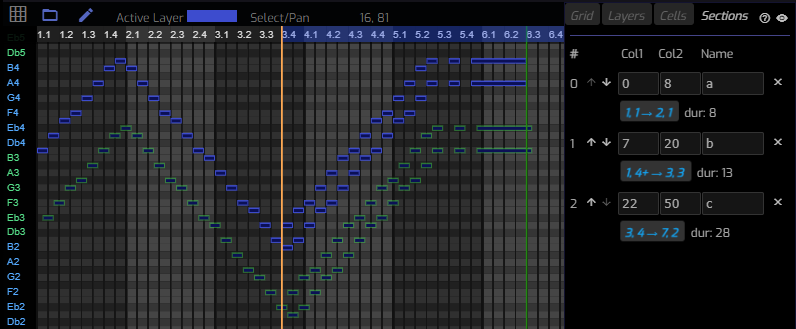
Below you see scale.fgrd. Note that there are two different colors of cells. This
implies that there are two layers in this file. The NoteGrid node allows you
to perform a single layer or all layers in a file. Layers are identifies by
their order/index (from 0-N) in the Layers Panel.
Also note that there are 3 Sections in this file. These are
identified by their both an index and a letter. When the letter is entered
into the NoteGrid arrangement it constrains its performance to the
associated time period(s). Sections can also be used to navigate the
file. Push the highlights button to navigate to that region of time.

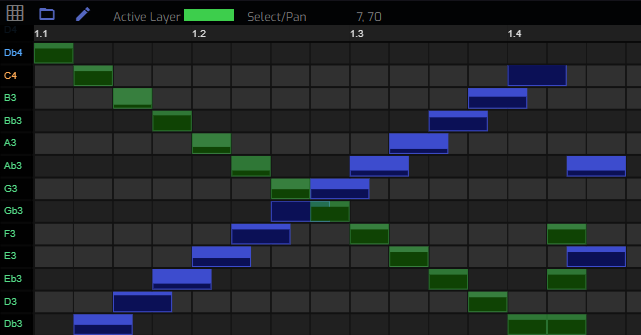
Here's oneOctave.fgrd, zoomed in both horizontally (in time) and vertically
(in "note-space"). Here we see that the individual grids display internal
detail in the form of a "bar chart". Each note includes a Velocity value
that can be edited via the Cell Panel or directly on the canvas in
Draw Value mode. In this example,
the darker color represents the velocity on a scale of 0 to 1. Higher
velocity notes play louder and this is one aspect of MIDI note expression.
Going farther, you can create/edit arbitrary expression channels within
a note. These channels are referred to by a variety of terms but in
the MIDI context, the term MPE
is currently in vogue. You can use the Layers Panel.
to activate, select color, and add sub-event channels. Only the active
channel on the active layer can be edited in Draw Value mode.
