/ Examples / Effects / Spectral
NoteStreams .. Instruments
Filters .. Effects .. LiCK Effects
Plot .. Utility .. Pure ChucK
Wherein we focus on image-based Spectral filtering and delays.
Right-click to copy examples to your workspace
Overview
Imagine turning a graphic equalizer on its side. Next, imagine stacking a bunch of equalizers next to each other with different settings for each segment of your composition. Now take a picture of these settings to produce an image. Here, a pixel's brightness represents the equalizer's slider position. If you're still with us, launch your favorite paint package (we recommend ImageEditor since image-file updates can be auditioned live). Now start editing or drawing patterns that represent the filter changes. Finally combine this image, an input signal, and Spectral to obtain intuitive and complete control over its spectral filter and delay effects.
Spectral is built atop DbSpectral chugin that implements time-varying audio filtering described by an image file. DbSpectral reads image files (.png) representing a spectrogram. Each color channel (R, G, B) of your image controls a different aspect of the filter according to its Mode setting.
The image y-axis is interpretted as uniformly sampled frequency from high at image top to low at bottom. You can map the image height onto a frequency range but should be mindful that there's a limit to the size of frequency bins driven by the underlying spectral decomposition of the FFT.
The image x-axis is interpretted as time and you can define a scanning rate (measured in pixels/second) to control the rate at which the current filter weights are updated.
For this example, we'll be using this image:

We'll be operating in a mode that interprets the red image channel as the EQ values and the green image channel as the spectral delay. Hopefully you can quickly surmise the following by inspection:
- the vertical red "cursor" represents the current filter settings.
- the thin red mountain represents a narrow filter passband that sweeps from low to mid to low.
- the red circles and lines above the mount accentuate high frequencies for a brief time.
- the green, slanted, vertical ramp causes higher frequencies to be delayed more than lower frequencies.
- the fact that the green ramp is slightly slanted means that the delay amount for a perticular frequency (row) is slowly changing. This can cause interesting pitch-shifting effects.
Spectral Node
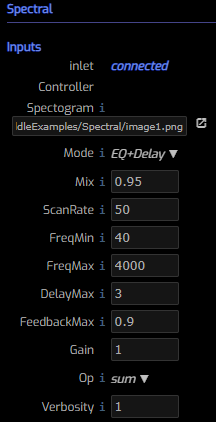
Here are the controls for the Spectral node. We'll use this node in the example graph depicted below.

Spectrogram the name of the .png file containing control information.
Click on the arrow to its right to launch ImageEditor
on the image. When images are saved, ImageEditor sends a request to
Fiddle/ChucK to reload the image live. Also, when a graph performance
includes Spectral nodes, ImageEditor displays a red vertical cursor
to indicate the current image location. Within the graph editor, the
current image column is indicated by the green "progress bar" at the
bottom of the Spectral node.
Mode controls which image channels affect the filter. Choose from:
- EQ Only (R)
- EQ + Delay (RG)
- EQ + Delay + Feedback (RGB)
Mix controls the mix of dry (0) an wet (1) signals.
ScanRate controls the scanning rate of the image, measured in columns per second.
FreqMin represents the minimum frequency controlled by the image.
FreqMax represents the maximum frequency controlled by the image.
DelayMax controls the maximum delay. Set to 0 to disable all delay effects.
When operating in EQ-Only mode, this value represents a constant delay used
for all frequencies at all times. In the other modes, this delay occurs wherever
the image green channel value is maximum (ie 255).
FeedbackMax controls the maximum delay feedback value. Set to 0 to disable
all feedback. When operating in EQ+Delay+Feedback mode, this value represents
this feedback value occurs wherever the image blue channel value is maximum
(ie 255). In EQ+Delay mode, this value is a constant feedback across all
frequencies and times.
Gain a multiplier for the node signal.
Bypass allows you to bypass the effect.
Verbosity when non-zero helpful information about image loading and resampling
is logged to the console.
Image Editor Tips and Tricks
Image Editor has per-channel editing capabilities to facilitate separate but equal editing for the spectogram images.
- Hotkeys
1,2,3,4,5move between channels R,G,B,A,RGB. Editing operations affect only the active channel(s). When moving between single channel and full-color modes, the image will appear different. Ie: in single channel mode, things are "black-and-white". - Save (
Ctrl S) triggers updates to live the ChucK session that is performing the image (via Spectral). - Zoom in/out and Pan can be accomplished with the mouse wheel with
optional
Ctrl,Shiftkeys depressed. - Hotkey
sselects the selection tool.- Now
Ctrl Aselects all. Escapeselects none.Delete,Backspaceclears the selected pixels.
- Now
- Hotkey
aselects the arrow tool.- The arrow head can be disabled resulting in a triangle tool, handy for "crescendo" regions.
- Hotkey
lselects the line tool.- A wide line can be used to produce "ramps" since you specify the line width (often large) and line start and end colors.
- Modifier key
Shiftcan be used to constrain lines (and arrow) to the nearest 45 degree angle. - Line caps can be round or "butt" style. This is controlled via the settings dialog. The latter is useful for ramps.
- Copy and Paste can be quite handy (including to/from other apps).
The Example
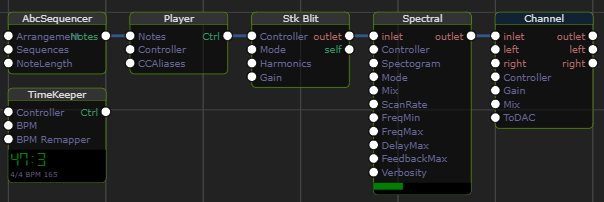
In this example we feed a simple repeating sequence of notes through a harmonically rich Blit instrument into our Spectral node. Timekeeper is present to control and visualize the tempo. The green bar at the the bottom of Spectral indicates the "cursor" location within the image representing the current filter parameters.
