
REF / Music API / Plot
Ascene
. Anode
. Agraph
. Aengine
Songbook
. Song
WSLoader
. Sound Loaders
Random
. Rhythm
. TimeKeeper
MIDI
. OSC
. HID
. Piano
Plot
. Envelope
. Util
Music Theory with Tonal
home . Topics . Interface . Reference . Examples
There are times you just need to get geeky and visualize some aspect of your songs or audio configuration. Hz includes some
2D plot surfacesin its Audio Monitor panel and you can use this API to dispatch your own data to appear there.
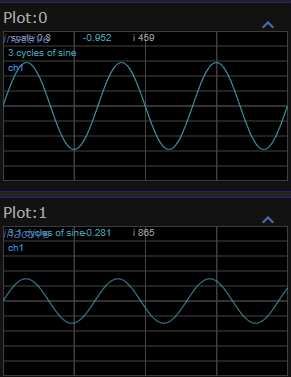
// minimal signal plot example, no audio thread running
let plotId = 0;
let chanId = 0;
let data = [];
data.length = 512;
for(let i=0; i<data.length; i++)
{
    data[i] = Math.sin(3*i/511*Math.PI*2);
}
PlotSignal(plotId, chanId, data, "3 cycles of sine");

plotId = 1;
data.length = 1024;
chanId = 0;
for(let i=0;i<data.length;i++)
{
    data[i] = .4*Math.sin(3.1*i/1023*Math.PI*2);
}
PlotSignal(plotId, chanId, data,  "3.1 cycles of sine");