
.. / Hz.Builtins / Hz.Scope
Hz.StreamIn . Hz.AudioFileOut . Hz.Scope
Hz.ModLFO . Hz.ModRand . Hz.ModEnv . Hz.ModExpr
see also Hz.Plugins, Hz.Builtins Examples
Here we explore the analysis features of the Hz.Scope builtin.
Overview
Hz.Scope is unique among Hz's built-in plugins. Its job is not
to synthesize or filter audio, but rather to analyze it and to
periodically plot its results to the Audio Monitor
and depicted here:
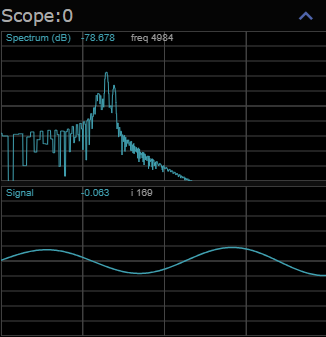
Hz.Scope produces two analyses. At top you can see the Fourier Spectrum
with log frequency along the x axis and signal amplitude (in dB) along
the y axis. Below this is the Signal Snapshot which represents a couple
of cycles of the audio signal amplitude.
This plot is updated multiple times per second and so it's everchanging. Use these plots to gain insight into audio qualities or anomalies in your soundscapes.
Usage
Hz.Scope is an opt-in capabiility because it consumes non-trivial compute
resources. To use it, just wire a Hz.Scope into your audio graph.
Its very presence in the graph is what triggers the analysis.
Here's the relevant javascript snippet from the Hz.Scope example.
let scene = await Ascene.BeginFiber(this);
let o1 = scene.NewAnode("Hz.Osc")
let gain = scene.NewAnode("Hz.Mix");
let scope = scene.NewAnode("Hz.Scope");
let dac = scene.GetDAC();
scene.Chain(o1, gain, dac, scope);
scene.VisualizeGraph("ascopeOsc.js");
await scene.Sync();
Here we chain Hz.Scope after the DAC but you can place the scope
elsewhere in the audio graph to analyze the audio signal there.